Quantitative risk management, defensible before a board.
Relvik brings together, in a single system, the rigor of the Mosler Method with Monte Carlo simulation, Poisson distribution and Sobol sensitivity analysis. You move from subjective assessment to metrics a board won't argue with.
Rigor isn't there to overwhelm: it's there so every number is defensible. Relvik integrates what the market usually keeps scattered.
Mosler Method
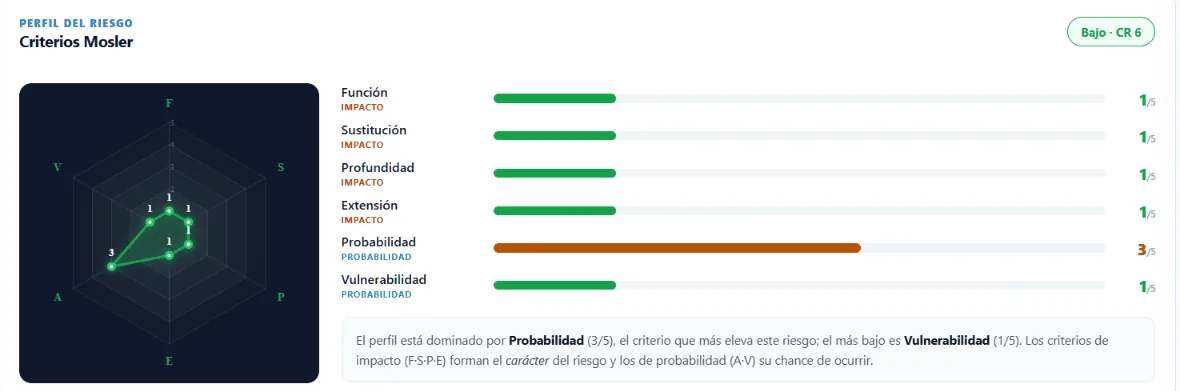
Impact across 6 dimensions (Function, Substitution, Depth, Extent, Aggression, Vulnerability) and a Risk Coefficient with a radar chart.
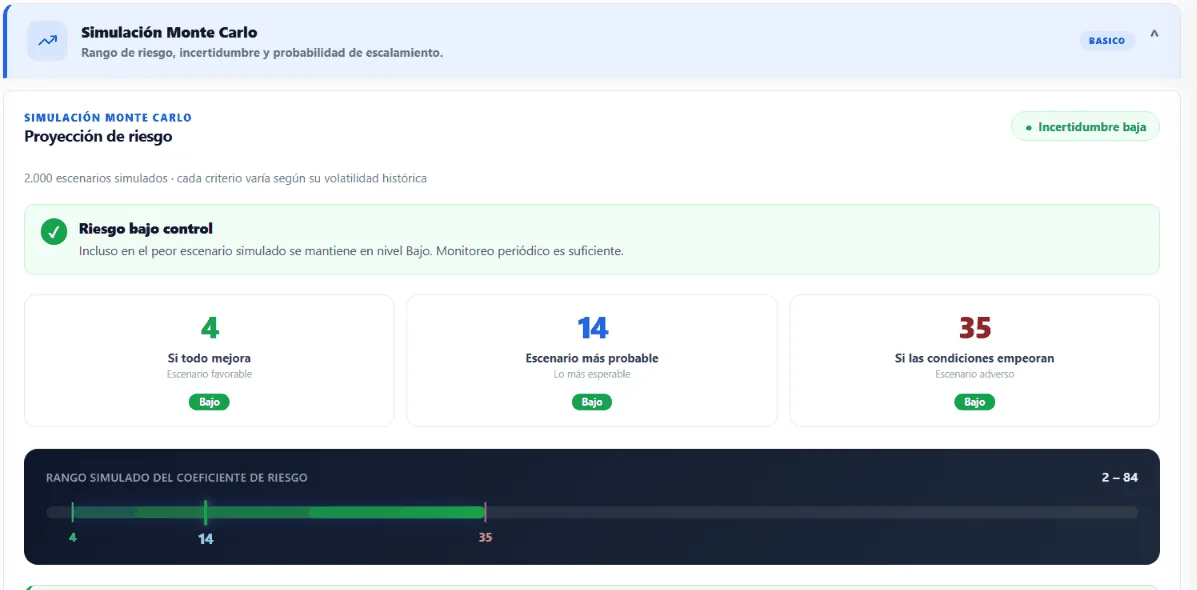
Monte Carlo
500 scenarios per risk (optimistic, central, pessimistic): p10 / p50 / p90 percentiles and escalation probability.
Poisson Distribution
Frequency and probability of occurrence on a statistical basis, not intuition.
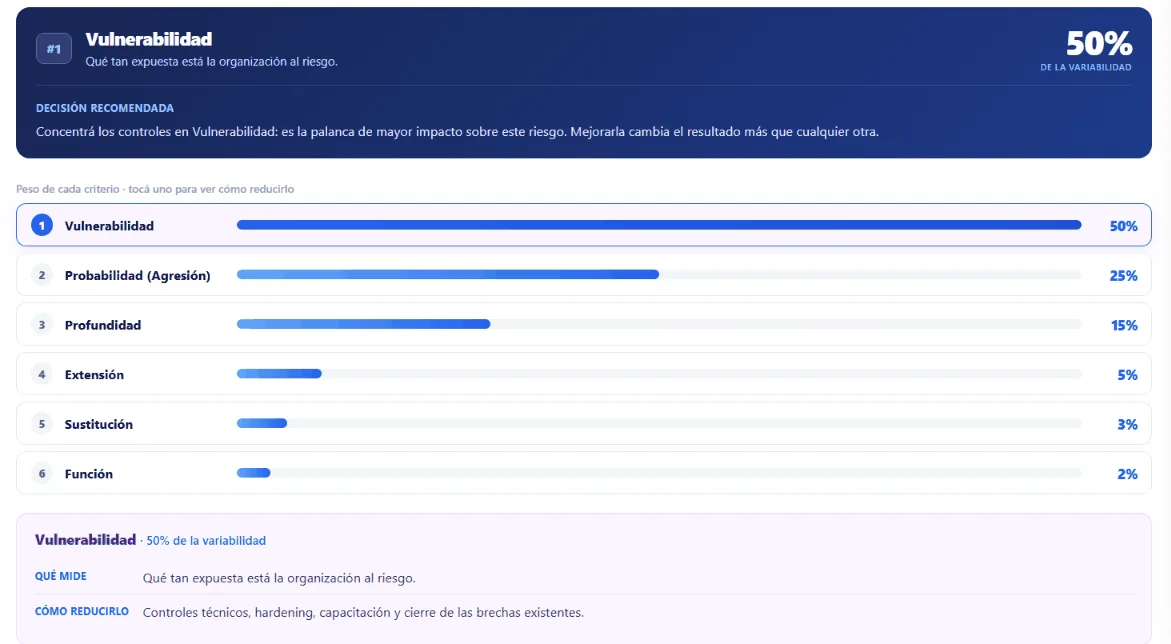
Sobol Sensitivity
Identifies which variable reduces risk the most, so you act where it has the greatest impact.
If something happened 3 times last year, what's the chance it happens next month?
Math has an answer. With the Poisson model, Relvik turns a historical frequency into an estimated probability, not a hunch.
This is an illustrative sample. In the platform, Relvik computes it on your real historical frequency and by event type.
22%probability that it happens at least once
Low probability≈ 0.3 expected in the period
78%0doesn't occur
19%1time
2%2times
0%3
0%4
0%5+
How many times it could occur in the period (and with what probability)
μ = expected value (average number of occurrences)
Times it occurred last year
3
times
Project to
Quantify each risk with method, not opinions.
You assess with Mosler, compute probability with Poisson, project 500 scenarios with Monte Carlo and detect the key variable with Sobol. All in a defensible risk record.
Risk coefficient and 6-dimension radar
Time projection and escalation probability
Sensitivity analysis to prioritize action
Relvik · Risk profile (Mosler)
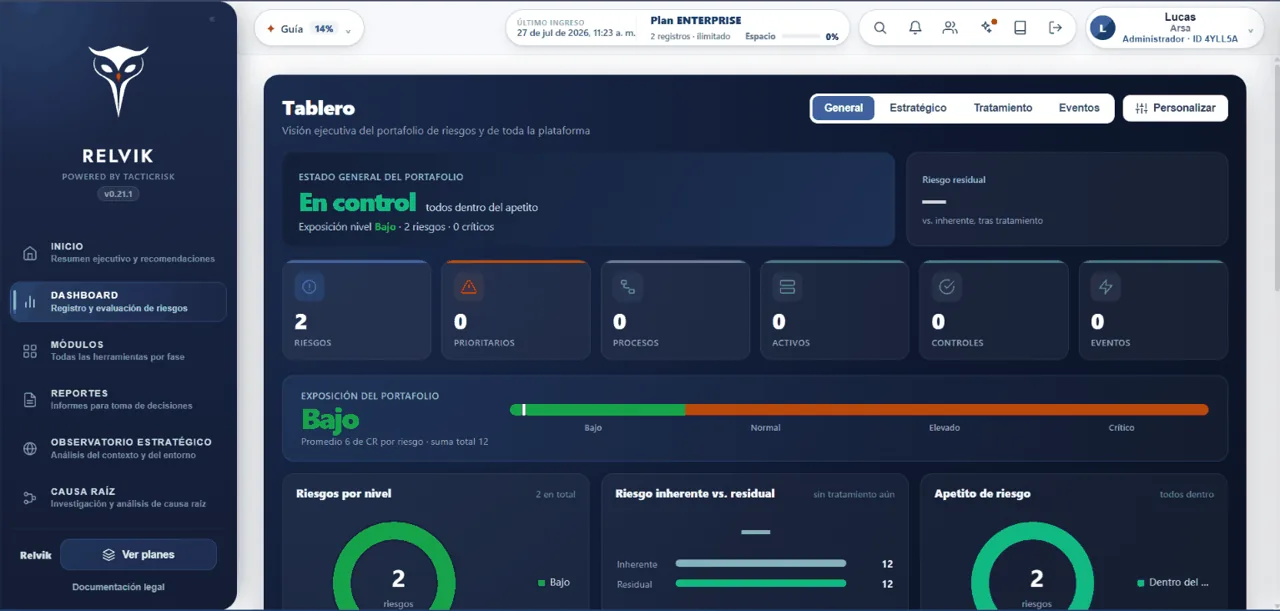
The state of your risk portfolio, at a glance.
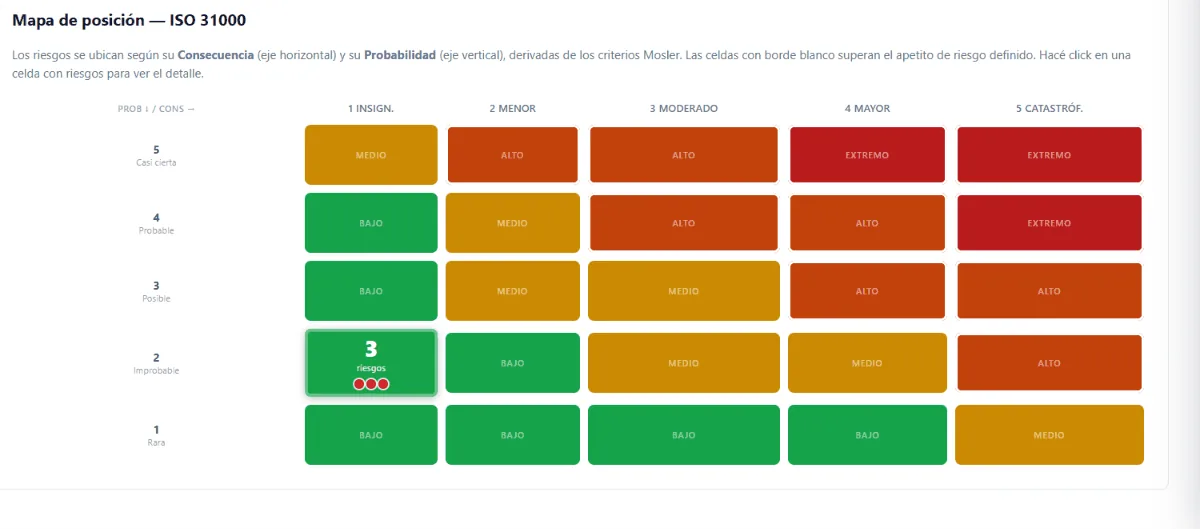
An executive dashboard with real-time KPIs and a 5×5 heat map by Probability × Consequence, with configurable risk appetite and alerts.
KPIs: total risks, critical, high and analysis quality
5×5 heat map with configurable appetite
Controls and matrix aligned with ISO 31000
Relvik · Executive dashboard
From analysis to plan, with owners and residual risk.
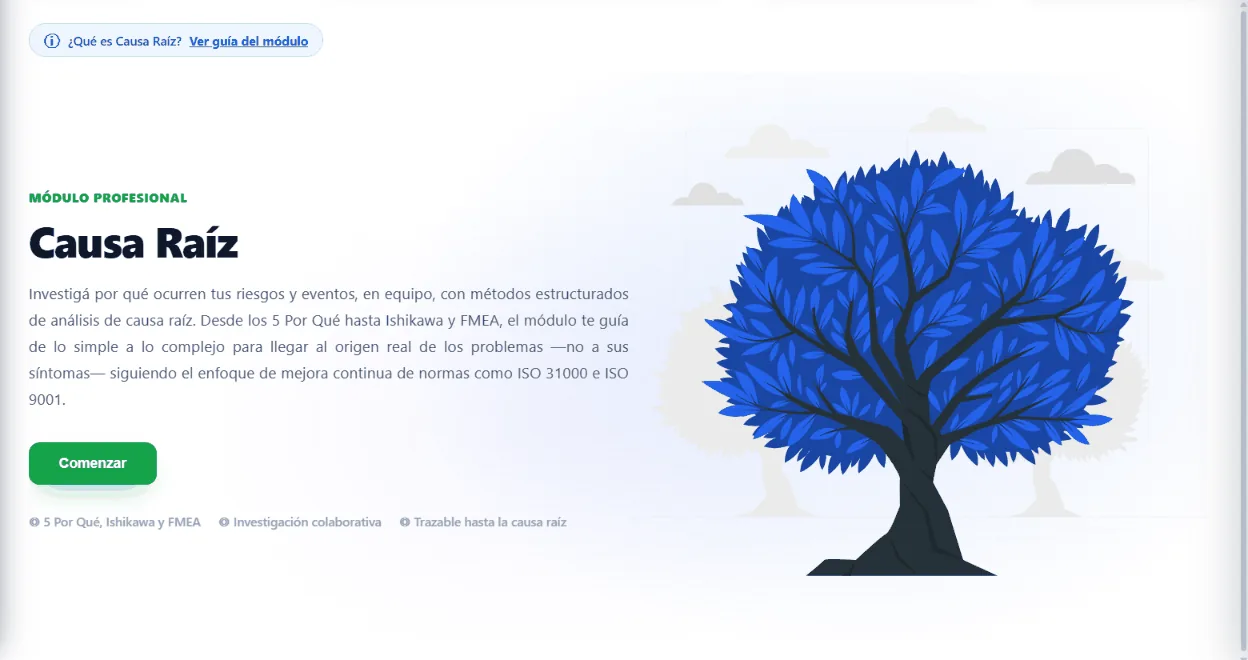
You investigate root cause with 5 Whys, Ishikawa (6M) and FMEA (RPN), define treatment plans with owners and deadlines, and demonstrate residual risk and avoided risks.
5 Whys, Ishikawa (6M) and FMEA
Treatment plans with computed residual risk
Avoided risks and a tamper-proof audit log
Relvik · Root cause
The platform inside
The entire risk-management cycle, covered.
Each module exists because it solves a concrete risk-management problem. Here's what each one does and which pain it tackles.
ISO 5×5 matrix and risk appetite
Probability-by-impact heat map, with configurable thresholds and the risk appetite declared by the organization.
SolvesTranslates numbers into an image a board grasps at a glance, and puts in writing how much risk the company accepts.
Monte Carlo simulation
Runs thousands of scenarios to estimate the loss distribution: best case, worst and most likely (p5, mean, p95).
SolvesShows the full range of what can happen, including the tail of extreme events, instead of a single average number.
Sobol sensitivity analysis
Identifies which factors most influence a risk outcome.
SolvesTells you where to put resources: which variable to move so the risk actually drops.
Bow-Tie analysis
A bow-tie diagram with the event at the center, its causes on the left, its consequences on the right and the controls on each side.
SolvesMakes visible in a single drawing why something can happen, what would happen if it did and where controls are missing.
Root cause analysis
Three methods to investigate why an event occurred: 5 Whys as a tree, Ishikawa diagram and FMEA analysis.
SolvesAvoids putting out the fire without understanding what caused it. Attack the root, not the symptom.
Treatment and action plan
ISO 31000's four strategies (mitigate, accept, transfer, avoid) with actions, owner, date, indicator and residual risk.
SolvesCloses the gap between detecting the risk and doing something about it. Every action has an owner and a date.
Controls and their effectiveness
A record of the controls that mitigate each risk, with an assessment of how well they work in practice.
SolvesDistinguishes between having a control and being protected. A control that exists but does not work gives a false sense of security.
Key Risk Indicators (KRI)
Metrics with thresholds and periodic readings that warn when something goes out of range.
SolvesMoves from reactive to preventive management: the indicator sounds before the risk materializes.
Events and incidents
A record of what actually happened, with criticality, associated losses and recoveries.
SolvesTurns every incident into learning and into data to recalibrate the probability of future risks.
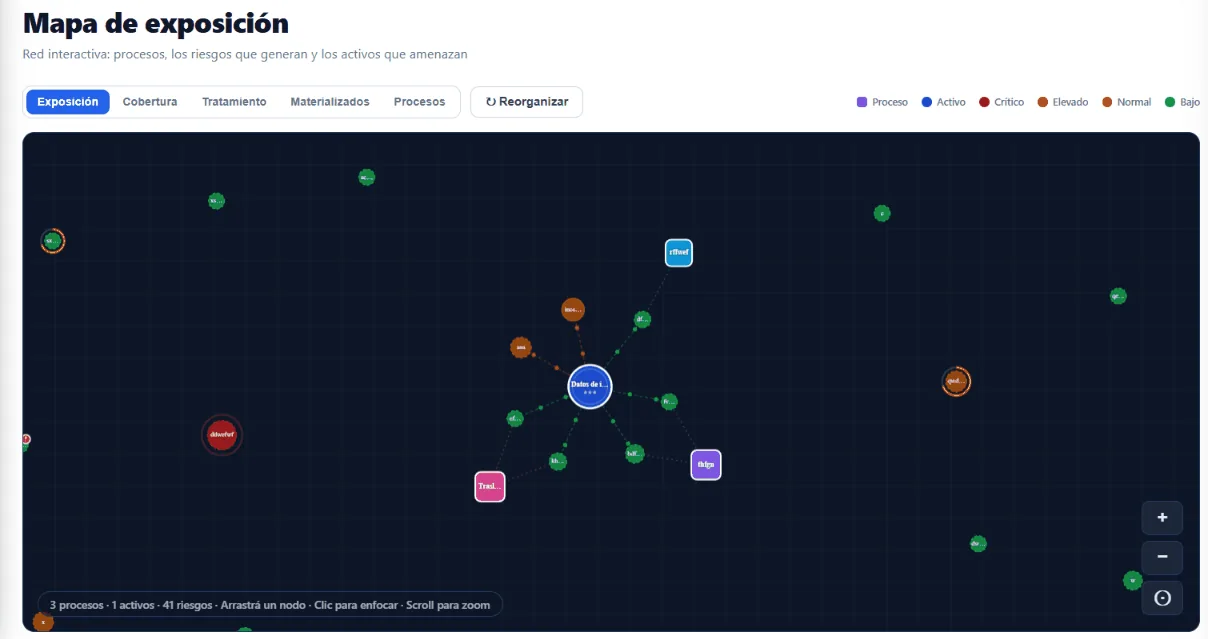
Assets, processes and organization
Inventory of assets with their strategic value, processes with their criticality, and structure by site and business unit.
SolvesContextualizes risk and lets you see the profile by site or by unit, not just the consolidated one.
Regulatory compliance and policies
Inventory of applicable regulations with issuer, version and expiry dates, plus a repository of versioned policies.
SolvesWhen a regulation changes, the system flags which risks and controls to review. No more finding out late.
Avoided risks
A record of the value of risks that did not materialize thanks to management.
SolvesMakes visible the return on risk-management investment, which is invisible by nature: the crises that never happened.
Plus: assessment with the Mosler method, probability with the Poisson model, geographic risk map, data-quality score, executive PDF reports, scheduled reports, multi-company with roles and an API for integrations.
Want to see these modules working with your own risks? We'll give you a guided tour.
AI doesn't replace the risk manager. It gives back the hours lost building reports.
Relvik analyzes the data your organization has already loaded and returns a strategic reading: what's happening, what to address first and what changed in the context. You explicitly control what information is shared with the model.
Comprehensive strategic report
The AI analyzes the loaded data and drafts a strategic reading of the risk status, with explicit control over what information is shared.
Priorities briefing
A summary of what to address first, built from the organization's real risk profile and the external context.
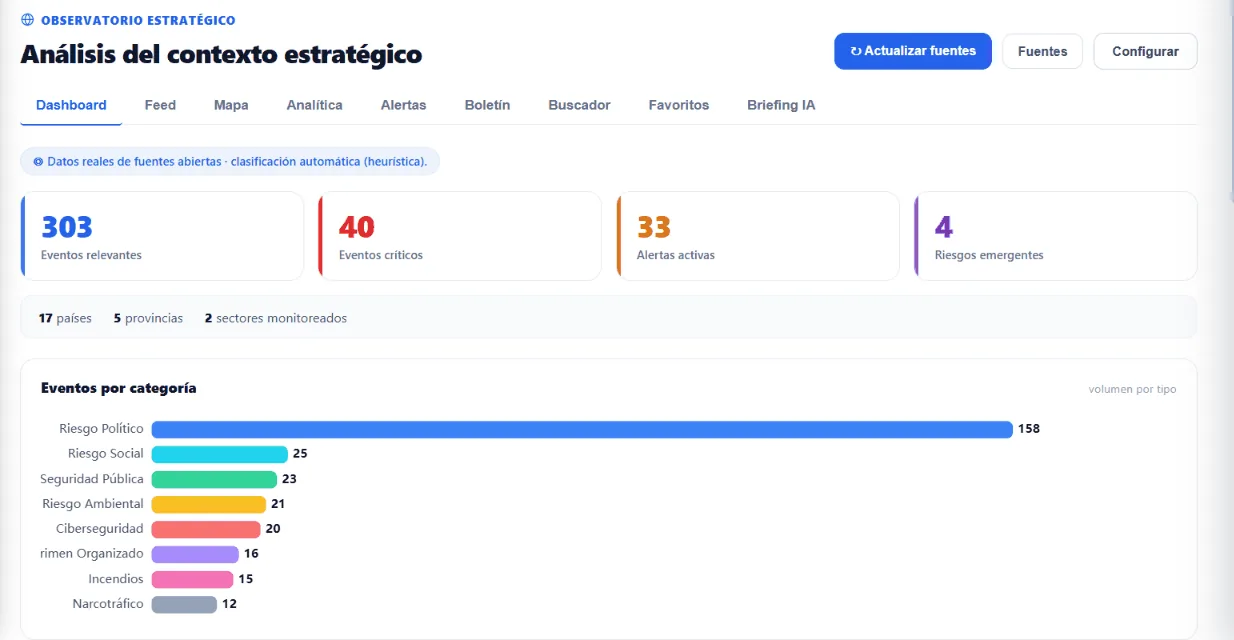
Strategic Observatory
Intelligence on the external context that drives your risks: environment analysis, strategic alerts and an executive bulletin.
The AI-assisted capabilities are included in the Enterprise plan. Your organization's data is not used to train models: you define what information is shared in each analysis.
We'll show you an AI-generated report on a sample case, no commitment.
Relvik stores every creation, edit and deletion (who, what, when and with which previous values) cryptographically chained, like a blockchain. If someone altered a record to cover up a mistake, it's detected. Always.
Chained record, impossible to alter without notice
Evidence ready for audits and certifications
Complete history of every risk decision
Chain verified · no alterations
Risk A-102j.perez · 12:04
Mosler assessment · RC 240 → 180
#a91f
Control C-56m.gomez · 12:31
Effectiveness reviewed · medium → high
#7c2d
Plan P-19a.ruiz · 13:10
Action closed · residual risk recomputed
#e5b8
What Relvik brings to each role.
Each profile faces a different problem and uses the platform differently.
Risk Manager
Their pain
Proving to the board that the risk profile is under control, with data and not opinions.
What Relvik gives them
Objective Risk Coefficient with the Mosler Method
Full traceability of every decision
Executive reports and ISO 5×5 matrix
Compliance
Their pain
Keeping standards, policies and evidence up to date for audits and certifications.
What Relvik gives them
Regulatory inventory linked to risks and controls
Versioned policies with status and expiry dates
Tamper-proof audit log
SME Owner
Their pain
They know something could go wrong, but have neither the time nor a method to organize it.
What Relvik gives them
Step-by-step guidance: from the first data point to the decision
Free to start, no prior knowledge needed
A clear dashboard of what could go wrong and what to do
Consultant
Their pain
Delivers Word reports that are outdated the next day.
What Relvik gives them
A living platform to manage several clients
Professional method and always-current reports
Data isolation per organization
Internal Auditor
Their pain
Reconstructing what happened, who decided it and when.
What Relvik gives them
Chained tamper-evident log
Record of every creation, edit and deletion
Evidence ready for certifications
Security
Their pain
Prioritizing where to put always-limited resources.
What Relvik gives them
Quantitative assessment with the Mosler Method
Sobol sensitivity analysis
Bow-tie of causes, consequences and controls
Each role gets the information they need. We can arrange a demo focused on a particular profile.